Salinity refers to the saltiness of water caused by the dissolution of minerals in rocks, soils and decomposing plant material. For instance, the level of salinity in a river depends on the geological and climatic environments through which the river flows. Salinity increases downstream, as salts are continuously added through natural and human-driven processes such as mining, industry and agriculture, but are only minimally removed through technological interventions or diluted by precipitation.
High levels of salinity can lead to the "salinisation of irrigated soils, diminished crop yields, increased scale formation and corrosion in domestic and industrial water pipes, and changes in the biotic communities." 1 000 mg/L is considered moderate salinity and is generally tolerated by humans; however, at levels above 3 000 mg/L (high salinity) fatal intestinal damage and renal damage can occur (DEAT 2009).
In the Orange-Senqu basin, the main human sources of salt load are identified and reported in UNDP-GEF (2008) and summarised in the box below.
Box: Main Sources of Salt Load in the Orange-Senqu River Basin.
-
The discharge of sewage effluent from waste water treatment works
-
Water pumped from underground mine workings
-
Runoff and seepage from areas disturbed by mining and mine waste dumps
-
Runoff and seepage from industrial areas
-
Runoff and seepage from urban areas, especially those without formal sewerage and sanitation systems
-
Irrigation return flows
Source: UNDP-GEF 2008
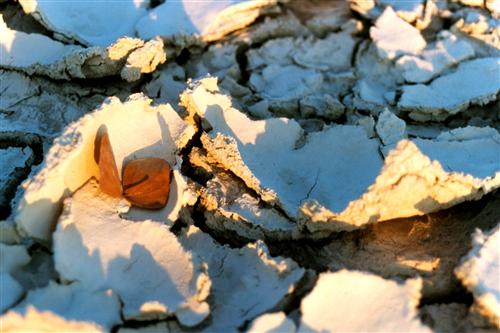
Salt encrusted soil in the Kalahari.
Source:Reed 2009
( click to enlarge )
Box 2: Trends in Salt Concentrations in the Orange-Senqu River Basin
Trends in salt concentrations in the inflow to the Vaal Dam
There are no significant trends in TDS concentrations in the VaalRiver inflow to the Vaal Dam at Villiers. However, there is evidencethat concentrations are higher in winter. Annual average TDS concentrations in the 1980's were generally around 150-200 mg/L while from the late 1990's concentrations ranged from 200-280 mg/L.
Average annual total salt concentrations in the Wilge River inflow to the Vaal Dam at Frankfort are generally lower at about 140 mg/L. TDS concentrations at this point show slight decreases since the mid 1990's, probably as a result of the import of water from the Lesotho Highlands.
Trends in salt concentrations at Orkney in the middle Vaal River
Salt concentrations in the middle Vaal River have fluctuated from over 950mg/L in the early 1980's to less than 600mg/L since the mid 1990's. There is a gradual decrease in salt concentrations over this period, due to the introduction of a dilution option. Under this option, salt concentrations in the outflow to the Vaal Barrage are kept at 600 mg/L, by releasing water from the Vaal Dam. Treatment and reuse of the acid mine water may also have some impacts on salt concentrations in the future.
Trends in salt concentrations in the lower Orange River
Salt concentrations in the lower Orange River show an increasing trend. In the late 1970's annual average salt concentrations were around 200 mg/L. These increased to 280-380 in the mid 1990's. This increase is statistically significant and may be associated with increased irrigation along this part of the river. Decreases in 2005 and 2006 were associated with higher flows and hence greater dilution. The provision of environmental flows for the estuary may regulate salt concentrations in this stretch of river in future.
To access an overview of the water quality situation in the Orange-Senqu River basin, please consultant the: "The State of the Orange Senqu River system – A Report on ORASECOM‘s First Joint Basin Survey JBS-1, Centurion 2011", in the Document Library.