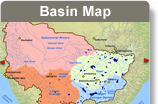
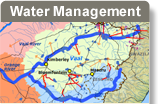
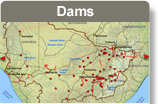
South Africa
The coastal areas of the Lower Orange Water Management Area are characterised by low water requirements, mainly from towns such as Springbok, Steinkopf and Port Nolloth. The total demand of 14,8 Mm³/a (2000) is just below the allocation of 15,6 Mm³/a. To put the total urban, industrial and mining demand of this Water Management Area into perspective, it is important to note that this demand represents less than 0,4% of the total Orange River System demand (Vaal System excluded).
Rural water requirements in the Lower Orange WMA account for 2 % of the total.
Table 1: Year 2000 urban water requirements in the Lower Orange River Water Management Area.
|
Sub-Area
|
Urban Population
|
Domestic (direct)
|
Indirect
|
Urban losses
|
Total
|
|
Urban per capita (domestic)
|
Urban return flow
|
|
Mm³/a
|
l/c/d
|
%
|
|
Mainstream Orange
|
109 926
|
5,7
|
3,3
|
3,0
|
12,0
|
|
142
|
4
|
|
Tributaries
|
90 810
|
3,9
|
1,8
|
1,9
|
7,7
|
|
119
|
0
|
|
Coastal
|
50 402
|
2,5
|
1,0
|
1,2
|
4,7
|
|
138
|
0
|
|
Total
|
251 138
|
12,1
|
6,1
|
6,1
|
24,4
|
|
133
|
2
|
Table 2: Year 2000 rural water requirements in the Lower Orange River Water Management Area.
|
Sub-Area
|
Rural Population
|
Domestic
|
Stock watering
|
Total
|
Rural human per capita
|
|
Mm³/a
|
l/c/d
|
|
Mainstream Orange
|
77 421
|
1,3
|
8,0
|
9,3
|
46
|
|
Tributaries
|
20 295
|
0,4
|
6,3
|
6,7
|
50
|
|
Coastal
|
8 944
|
0,2
|
1,2
|
1,4
|
56
|
|
Total
|
106 660
|
1,9
|
15,5
|
17,4
|
48
|
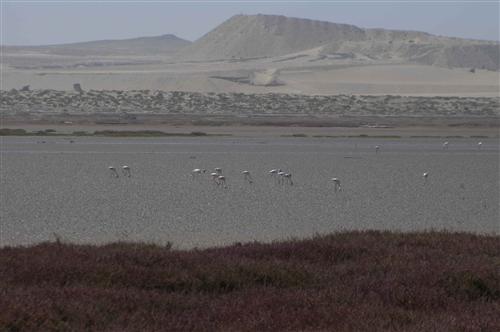
The Lower Orange River.
Source:Vogel 2009
( click to enlarge )
Botswana
Water requirements are minimal within the Orange-Senqu River basin in Botswana, as no mining or major irrigation activities occur there. Rural water demand is mainly for rural domestic use and stock watering, and generally supplied by small-scale groundwater abstraction or private boreholes.
Water demands for settlements in the Molopo Basin are expected to increase by 11% from 2001 to 2020, from about 3 600 to about 4 000 m³/d. The Botswana National Water Master Plan (BNWMP) projects that infrastructural developments at the rural level will continue into the future to accommodate the increasing water demands nationwide.
Namibia
Namwater supplies bulk water to Mariental and Keetmanshoop, the two major urban centers in the Fish River Basin and the only towns that abstract water directly from the Fish River (Hardap and Naute Dam). Other towns located in the Fish River Basin abstract groundwater through boreholes. Domestic (urban) and industrial demand in the Fish River catchment accounts for 3,5 Mm³/a or 7 % of the total demand. Only 0,9 Mm³/a is supplied from surface water sources, with the remainder (2,6 Mm³/a) from groundwater. The urban water consumption in the Fish River Basin (year 2002) is shown in Table 3.
Table 3: Urban water consumption in the Fish River Catchment (Mm3/a).
|
Area
|
Urban Demand
|
|
Keetmanshoop
|
1,79
|
|
Mariental
|
0,93
|
Rural water demand in the part of the Orange-Senqu Basin which falls inside Namibia is minimal, estimated at 0,32 Mm³/a for 2005, and is mostly satisfied by groundwater.