Overall, SADC depends on 11 % of its water being imported as virtual water to meet consumption needs (Kort 2010).
Quantifying Virtual Water Trade
Quantifying virtual water transfer between countries can put their water needs and availability into context (Hoekstra and Hung 2002).
Intra-SADC virtual water trade is made up of 23,82 % crop trade, 43,51 % livestock trade and 16,22 % industrial trade (Kort 2010). In the SADC region in 2002, 5 000Mm³ of water was transferred between countries through transfer schemes, and an estimated 8 000 Mm³ as virtual water. This equates to the transfer of 1 000 tonnes of water for every tonne of grain (Earle and Turton 2003).
When compared to the global average, the SADC region is generally not a water-efficient producer of crops but it is a water-efficient industrial producer (Kort 2010). Of all the water used for producing agricultural and industrial products in SADC, 8,69 % goes towards producing export products. Broken down, 8,46 % of the water that goes into producing agricultural products is for export products and
Between 1996 and 2005 the major share of products traded internationally with theS ADC region were agricultural products (Kort 2010). Crops accounted for 73 % of the virtual water exports and 74 % of the virtual water imports, with livestock accounting for 18% of exports and 13 % of imports and industry accounting for 9 % and 12 % respectively. Virtual water imports account for 11,04 % of the overall water footprint-related to agriculture and industry in the SADC region. The share related to agriculture is 10,21 %, while the share related to industry is 66,31 %. Due to trade in crop products, the SADC region is saving 11 028,5 mm³/yr of green water, 2 026,8 mm³/yr ofblue water and 1 366,6 m³/yr of grey water annually. These savings can largely be attributed to the imports of rice, maize, wheat and cotton. Losses are made in the export of sugarcane, oranges, coffee, beans and bananas (Kort 2010).
Table: Examples of crops that result in net total water saving and net total water losses in the SADC region.
|
Crop name
|
Net green watersaving(106m3/yr)
|
Net blue watersaving(106m3/yr)
|
Net grey watersaving(106m3/yr)
|
Net total water saving(106m3/yr)
|
|
Rice
|
3200,8
|
1714,1
|
817,1
|
5732,0
|
|
Maize
|
3198,1
|
14,7
|
90,4
|
3303,2
|
|
Wheat
|
2539,8
|
233,6
|
357,6
|
3130,9
|
|
Cotton Seed
|
2521,1
|
178,9
|
43,8
|
2743,9
|
|
Coffee, green
|
-379,8
|
-7,0
|
-1,4
|
-388,2
|
|
Oranges
|
-494,2
|
-12,6
|
-0,3
|
-507,1
|
|
Sugarcane
|
-917,6
|
-118,1
|
79,4
|
-956,3
|
Source: Adapted from Kort 2010
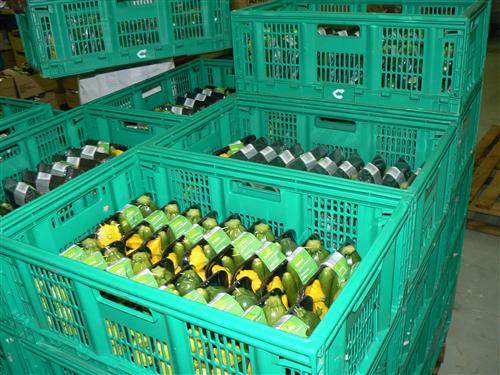
Cash crops grown in South Africa and shipped to another country, is one way that virtual water is traded.
Source:Kruchem 2008
( click to enlarge )
In the SADC region the water footprints of crops are generally high when compared with the global average (Kort 2010). This indicates that the SADC region is water-inefficient producer of crops. This inefficiency is largely attributable to the high atmospheric water demand of the semi-arid climate, the low yields due to the low input of fertilizers, pesticides and due to poor seed quality and poor agricultural infrastructure (Kort 2010). In contrast to the low efficiency of crop production, the efficiency of industrial production is quite high when compared with the global average. Future water conservation strategies should aim to optimise the water-efficient industrial products and reduce the production of water-inefficient crops.