Water quality issues influence both human and environmental health and the monitoring of this resource provides useful information for decision makers. The process of water quality monitoring involves acquiring samples of water to be analysed for specific parameters (analytes) that influence water quality. These are compared with water guidelines or standards to ensure the provision of safe water for human consumption, the environment and aquatic-marine life.
The World Health Organisation (WHO) released their most recent water quality guidelines in 2006.These have been categorised two-fold –those associated specifically with health risks and general usability guidelines –most commonly associated with odour or taste issues.
Several water samples tested along the Vaal and Orange rivers do not have health or usability specific guidelines, generally because these analytes are not considered to be present in the water at levels of concern associated with human consumption (WHO 2006).Of the analytes that do have WHO guidelines, the majority were within acceptable levels at stations along both rivers.
The map below, a sub-set of the overall monitoring system in the basin, shows some of the stations where water quality monitoring was conducted.
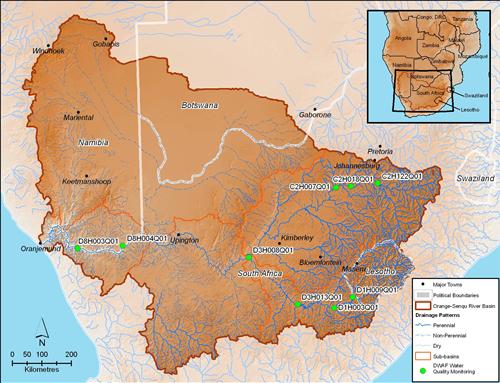
A sub-set of Water Quality Monitoring Stations
Source:Hatfield 2009, after DWA South Africa 2009
( click to enlarge )
Health Guidelines
Analysis of water quality data from the Orange Senqu River show two variables, E.Coli and Coliform were found to fall within unacceptable levels. These two are the only ones that fall under the WHO health guidelines and are associated with domestic waste.
These two bacteria were only detected at the most up-stream station on the Vaal River with sufficient data available only for the years 2007 and 2008. Data from both years showed bacteria levels to be well above the zero tolerance WHO health guideline, with annual average counts coming in over 30cfu/100ml. (34 and cfu /100mL respectively).
General Usability Guidelines
The measurement of the non–health related characteristics of the water were found as follows:
Inorganic salts (i.e. calcium, chloride, sodium) – remained below WHO usability guidelines during sampling events at all stations.
Water Hardness (alkalinity) – two down-stream stations on the Vaal River near Johannesburg measured levels exceeding those recommended in the guidelines, with a maximum concentration of 324 mg/L recorded at the site C2H007 in 2003.
Turbidity – at all locations along both rivers is generally higher than 5 NTU. This is well above the WHO recommended level of 0.1 NTU
PH level – on the Vaal and Orange rivers tends to range between balanced and slightly alkaline (i.e. within or above WHOs optimal range of 6.5 – 8)
General Time Trends
Historical Data at some of the stations that goes as far back as the 1970’s, shows that levels of inorganic salts associated with conductivity levels (i.e. calcium, chloride, magnesium) generally increased in both rives as did fluoride and compounds associated with fertilizers. The 1980’s saw a decline in this trend but have recently seen undergone an increase at the most downstream station of the Orange River. pH levels at the two downstream-most stations on the Vaal River have trended toward a more consistently alkaline environment in recent years, similarly influencing the alkalinity of the Orange River downstream of its confluence with the Vaal .Phosphates have generally increased over time on the Vaal River, and have fluctuated on the Orange River; nitrates have undergone a general decline over time. Both fertiliser compounds, however, were observed to spike in 2008 at the upstream-most station on the Vaal River, near Johannesburg. Over time, boron measured at the upstream-most station on the Vaal River has declined.
General Spatial Trends
Water quality on the Vaal River at the two most downstream stations has clearly been more impacted by industrial and urban activities than at the upstream dam station or at any stations along the Orange-Senqu River. Specifically, levels of inorganic salts (i.e. chloride, sodium, and potassium), associated conductivity and hardness, pH, fluoride, ammonia, and fertiliser compounds (i.e. phosphate and nitrate) have been consistently much higher at these two stations than elsewhere.
Evidence of these anthropogenic inputs affecting the Orange River is apparent from the higher concentration s that have been read off the
Mixing of these anthropogenic inputs from the Vaal River into the relatively less affected Orange River is apparent, as concentrations of analytes become slightly higher downstream of the confluence of the two rivers when compared with the Orange River upstream of the confluence. Levels of nitrogen and phosphorus, nutrients commonly associated with sewage discharge and agricultural wastes and chemicals, are also consistently higher at the two down-stream Vaal River stations relative to the upstream dam station, but have also been similarly elevated at the upstream-most station on the Orange River, diluting with distance downstream.
In contrast, levels of silicon were clearly greater in the Orange River, particularly upstream of the confluence with the Vaal River. Silicon can be derived from natural or industrial sources. Similarly, turbidity of the water in the Orange River was higher than in the Vaal River; this trend was particularly evident in the 1990’s, but has continued to be apparent in recent years.
The figures below show the temporal and spatial trends for two important water quality analytes indicative of agricultural and mining activities: Electrical Conductivity and Sulphate.
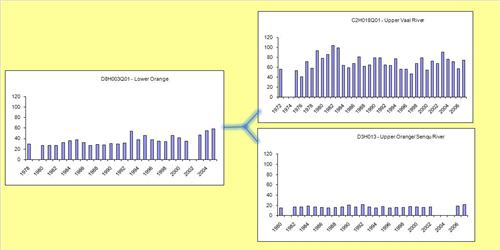
Conductivity levels in the basin.
Source:DWAF South Africa 2009
( click to enlarge )
IWRM and Water Quality Monitoring
The second phase of the ORASECOM Basin-wide integrated water resources development plan (IWRM) includes the development of a Water Quality Monitoring Programme. The integrity of water quality analysis is often questioned by member states and a need for a collaborative monitoring program and reporting system was expressed by member states (ORASECOM 2011).
The programme is intended to establish guidelines, protocols, institutional requirements as well as build capacity within the basin states to operate the water quality monitoring system that will ensure standardised methods are used for water quality sampling across the basin and allow for any inconsistencies to be identified thus producing a trusted set of data. Trans- boundary points have been selected across the basin and the monitoring will be conducted on a monthly basis, with laboratories (which have been identified) from each of the member states conducting an analysis. A clear method has been outlined for this process as well as proposed data management system.
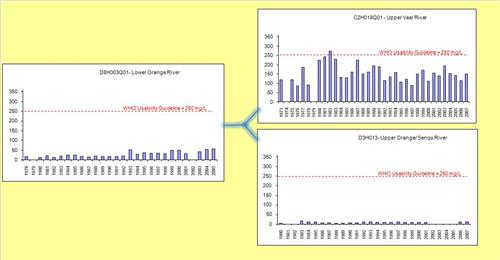
Sulphate levels in the basin.
Source:DWAF South Africa 2009
( click to enlarge )
Joint Basin Water Resources Survey
In 2010, a Joint Basin Water Resources Survey was undertaken by ORASECOM. This assessment of the watercourses of the basin water resources was intended to provide consistent and standardised baseline information for the basin states. Future improvements will be measured against these results.
Sixty sites across the basin were identified and close to 300 samples were collected and sent to selected laboratories in the participating member states. In order to ensure that the quality of data was standard for the entire survey, the same sample of known concentrations taken from 10 sites in the basin was sent to each of the basin state laboratories. The results of each laboratory were compared and areas of improvement were identified.
Standards were agreed upon for the following variables that were measured by the the survey:
-
Aquatic Ecosystem Health To assess the state of aquatic ecosystems based on the species found;
-
Persistent Organic Pollutants (POPs) and Metals Survey To assess the presence of pollutants which may affect human health even when in low concentrations;
-
Water chemical and biological quality To assess the impacts of major pollution sources on the system; and
-
Inter-laboratory benchmarking process To help laboratories in all the countries establish quality control procedures
To access an overview of the water quality situation in the Orange-Senqu River basin, please consultant the: "The State of the Orange Senqu River system – A Report on ORASECOM‘s First Joint Basin Survey JBS-1, Centurion 2011", in the Document Library.
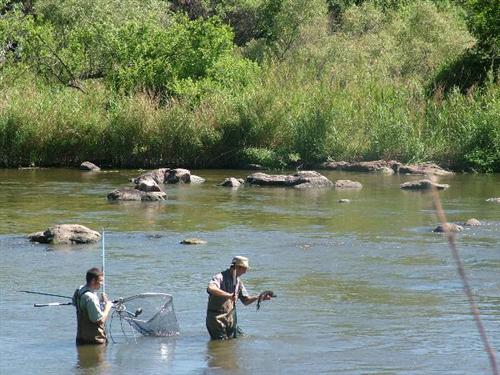
Sampling activities during the first ORASECOM Joint Basin Water Resources Survey.
Source:ORASECOM 2010
( click to enlarge )