
Documentation and Data:
A read-only folder structure of all reports, data, and models related to the STAS can be accessed from here:
https://wis.orasecom.org/content/study/GIZ/Improving Groundwater Knowledge of Transboundary Aquifers
- Report: Groundwater Recharge in the Karoo Sedimentary and Khakhea/Bray Dolomitic Aquifers – Report still in draft format. Will be published once finalised
- Maps: Images
- Maps: View and download layers on GIS Server (OGIS). See the interactive map below.
- ORASECOM TORs: Documentation
- Data: Groundwater level data, recharge calculations and other data
- Models: Configurations and data
- Related Articles: Stampriet Transboundary Aquifer, Improving Groundwater Knowledge in Selected Transboundary Aquifers, Karoo Sedimentary Transboundary Aquifer
Technical and Financial Support:


Implementing Partner:
![]()
Introduction
This analysis formed part of the Improving Groundwater Knowledge in Selected Transboundary Aquifers Study. The importance of groundwater has generally been understated in the past. Since its inception, ORASECOM has made efforts to resolve this, but it is only in recent years that the significance of groundwater at the regional and basin-wide level is being given due consideration. This study aimed at improving the knowledge of selected Transboundary aquifer systems in terms of recharge estimations, monitoring of important characteristics of the aquifers and for the development of a groundwater focused Information system.
The importance of recharge estimations
For the implementation of groundwater management and the quantification of groundwater resources, the volumes of recharge to aquifers and its temporal distribution is required, since it defines the volume of the resource. The quantification of recharge is increasingly given attention in the management of groundwater, particularly in semi-arid regions where the average rainfall is generally low and the evapotranspiration rates are high. To ensure the long-term sustainability of this resource, it is essential that the groundwater recharge is estimated. Recharge is the ultimate upper boundary defining potential groundwater abstraction if an aquifer is not to be mined out.
Although in terms of groundwater resources, annual variations in recharge are somewhat buffered by aquifer storage, baseflow from a groundwater origin is less buffered and low recharge years can result in very low flows, which have an impact on the ecology as well as the yield of dams and surface water resources.
As part of this study, an estimation of recharge was done for the Khakhea-Bray and Karoo-Sedimentary Aquifers. This article summarises the output for the Khakhea-Bray Aquifer. All detailed can be found in the report as stated at the start of the article.
Aquifer location
The Khakhea-Bray Transboundary Aquifer is situated on the borders of Botswana and South Africa, which is formed by the non-perennial Molopo River. The location of the aquifer and settlements in the area are provided on the interactive map in Figure 1. The map also provides information about rainfall and groundwater level monitoring sites in the area as well as the final recharge values that were calculated during this analysis. Please note: the map will initially take some time to load.
Figure 1: Khakhea-Bray Transboundary Aquifer
Notes: To interrogate the data on the map please select the ![]() icon and click on the item. To see the map in detail on a separate page please go here.
icon and click on the item. To see the map in detail on a separate page please go here.
Climate
The study area is characterised by a low annual rainfall. The average for all selected stations is 376 mm/a. Rainfall is less than evaporation in all months except the wettest years on record. Rainfall varies from 174-715 mm/a. The Mean Annual Catchment Evaporation is 2107 mm/a.
Geology and geohydrology
The Khakhea-Bray is defined by the area of dolomitic outcrop of the Campbell-Rand dolomites, including where it is overlain by Kalahari sands, and bounded by where the dolomites dip under banded ironstones. The geology of the aquifer consists of 2 units of interest:
- Kalahari Group: Quaternary and tertiary sediments, pan sediments (sand and clay), diatomaceous limestone and aeolian sand, with extensive coverage all over the area; and
- Griqualand west/ Kanye basin: Predominantly carbonate rocks such as limestone, and dolomite with interbedded chert. They lie conformably on the Vryburg Formation, which is the base of the dolomite and consists of quartzite, flagstone and grit.
A geology map for the area is provided in the Figure 2.
Figure 2: Geology of the Khakhea-Bray Transboundary Aquifer
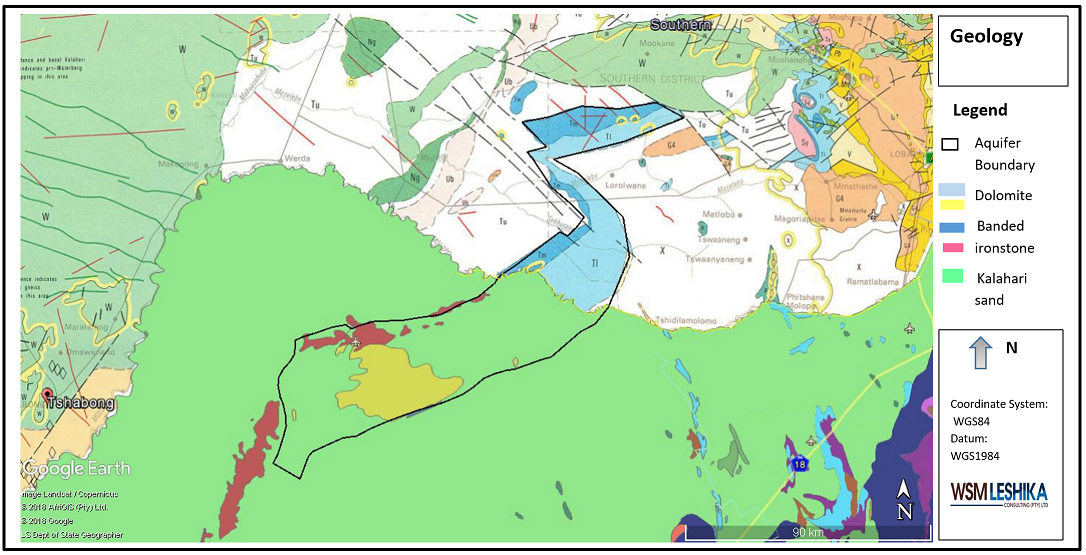
A full Lithology and Stratigraphy analysis were undertaken during this assessment. The geohydrological features of the aquifers are described in terms of the characteristics for Dolomitic and Kalahari Group Aquifers with typical aquifer yields and thicknesses. Dolomitic compartments were extended from an initial 3 compartments (from a previous study) to 6 compartments to include the Botswana side of the aquifer. In summary three main, geologically controlled, aquifers were identified within the aquifer which include:
- Brecciated and leached zones along faults, a high yielding aquifer within the area.
- Fracture zones associated with the intrusion of post-Karoo dolerite dykes and sills. Along these sills and dykes, relatively high yielding fractures are intersected. The extent of these fracture zones and compartmentalization impede the long-term, sustainable, yield from these zones. Pump testing and water level response to abstraction indicate poor recovery after pump testing, resulting in long-term water level declines.
- Transition zone between the dolomite, shale bands and the banded ironstone.
Groundwater use and levels
Water level monitoring level data is available only for boreholes in the vicinity of Pomfret in RU3, where dolomite and banded ironstone outcrop exist, and only for a limited period. These boreholes are not all in the same sub-compartments hence do not respond in the same way. Abstraction for Pomfret mine stopped in 1986, however, the only record covering this period was not in a compartment utilised by the mine. Abstraction began in 1989 by the South African Defence Force (SADF). Water use declined after 1994, then again after 1997, after the SADF withdrew from the military base.
Water levels clearly indicate declining levels due to over-abstraction. From the general lack of annual water level rises, it is evident that recharge is not an annual event, or annual recharge is very low seen from Figure 3.
Figure 3: Groundwater levels in the Khakhea-Bray Transboundary Aquifer
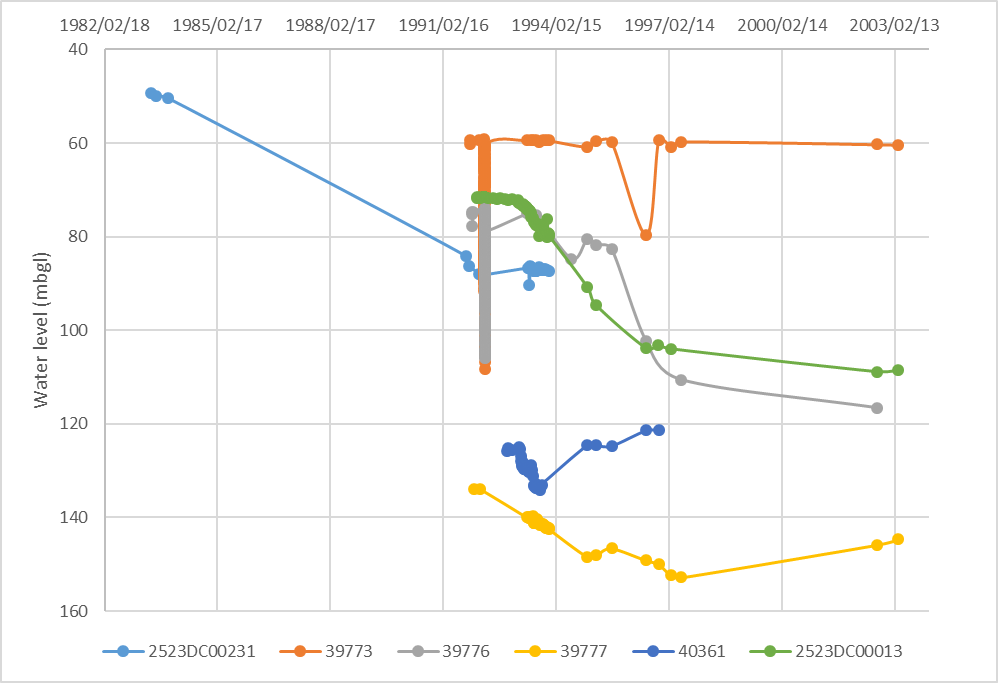
In 2013 compulsory licensing allocated the total volume of 10.9 Mm3/a due to the over-use of the dolomitic aquifer. In 2016 an additional 20% restriction on irrigation was implemented reducing the total abstraction to 8.2 Mm3/a. Groundwater is the sole source of water in the Pomfret area for both domestic and agricultural purposes. As with the Tosca aquifer, the Pomfret aquifer is currently under considerable strain.
Recharge Calculations
Due to the episodic nature of recharge, very long-term monitoring of water level is required to derive, among others, a mean annual recharge estimate. Moisture retention within the unsaturated zone in areas covered by the Kalahari sands can have a considerable influence on recharge. Only very high rainfall events can initiate recharge. If recharge occurs only once every 10 years, then not only is the volume of recharge of relevance, but also the period of time between recharge events.
If 150 mm/month is required to initiate recharge, then recharge only occurs once every 140 months, or once every 11-12 years. It would require many years of water level data to establish an average recharge, if only water levels are utilised. Areas of higher recharge could occur near the Molopo river and its tributaries due to losses from infrequent floodwaters. This recharge, however, will be small because of the retention of potential recharge in the unsaturated zone, from where it is lost by evapotranspiration.
This implies that methods based only on water level data cannot be easily applied. In addition, the wide spatial variation in recharge depending on runoff in channels and thickness of the Kalahari sediments, makes any point scale measurement unrepresentative.
The recharge in the areas covered by the Kalahari sediments is believed to be negligible in areas with less than 300 mm/year of rainfall and the quality of the groundwater being poor. Selaolo (2003) found that recharge in the Kalahari was 0.5 ± 0.1 mm/a where rainfall is < 400 mm/a using chloride profiles in the unsaturated zone. They suggested a critical seasonal precipitation threshold of 400 mm/yr is required. However, Isotopic evidence suggests that recharge to the karstic aquifers is taking place, with tritium values ranging from 0 to 0.9 TU. The higher tritium samples (> 0.9 TU) with depleted δ18O signatures are indicative of more recent recharge, with groundwater flow within the karstic aquifers having responded quickly to precipitation. Verhagen using isotopes (2003) at Jwaneng found that recharge through the Kalahari was 3.7-4.7 mm/a from a MAP of 350 mm/a.
Four previous recharge assessments for the aquifers in this area were evaluated: Smit (1977), Godfrey and Van Dyk (2002), Van Dyk (2005) and Bredenkamp (2009). Bredenkamp (2009) estimated recharge for the South African portion of the aquifer using regional rainfall-recharge relationships.
This study utilised the same equations but developed a time series using a 48-month moving average of rainfall. Using average monthly rainfall eliminates the effect of wet period and underestimates recharge during wet periods. When the equations are applied to 48-month average rainfall, this study achieves a higher average recharge. This stresses that recharge can only occur above of a monthly threshold rainfall value and that average time series data cannot be used to derive an average recharge.
Recharge was calculated from the Cumulative Rainfall Departure Method for one borehole that met all the requirements for the method. The CRD method was applied and the following relationship was derived to match the water level decline to the CRD:
Recharge = (Rainfall – c) *b
Where Rainfall is monthly rainfall, c is the threshold rainfall to initiate recharge, calibrated to 100 mm/month, and b is the fraction of rainfall above the threshold generating recharge, calibrated to 0.1. It was assumed that outflow from the compartment is equal to the mean monthly recharge when no abstraction occurs and that inflow and outflow are zero when abstraction occurs. The mean annual recharge was found to be 1.68 mm/a, or 0.44% of rainfall. The monthly recharge values were aggregated to derive an annual rainfall-recharge relationship. The best-fit relationship for recharge is:
Recharge = (Rainfall -344) * 0.0372
Findings
Based on water level data from Pomfret, recharge appears to be sporadic, only occurring when rainfall exceeds 100 mm/month. The recharge calculated for areas overlain by banded ironstone agrees with the figures from Van Dyk’s modelling study but are somewhat lower than Van Dyk’s calculation based on the Chloride method. The calculated recharge also matches some of the relationships proposed by Bredenkamp, however, such exponential relationships generate recharge in all years, hence may not be suitable for areas with the Kalahari cover.
It is proposed that the CRD relationship developed in this study be utilised. Calculated recharge is shown in Table 1.
Table 1: Groundwater recharge in the Khakhea-Bray Transboundary Aquifer
| Resource Unit | Area (km2) | Mean Annual Precipitation (mm/a) | Mean Annual Recharge (mm/a) | Mean Annual Recharge (Mm3/a) |
|---|---|---|---|---|
| RU1 (SA and Botswana) | 2061 | 425 | 3.01 | 6.21 |
| RU2 (SA) | 637 | 425 | 3.01 | 1.92 |
| RU3 (SA) | 1885 | 380 | 1.34 | 2.52 |
| RU4 (Botswana) | 420 | 447 | 3.83 | 1.61 |
| RU5 (Botswana) | 256 | 447 | 3.83 | 0.98 |
| RU6 (Botswana) | 404 | 447 | 3.83 | 1.55 |
| Total | 5663 | 414 | 2.61 | 14.79 |