|
Hydrology:
Hydrology of the Orange-Senqu River Basin |
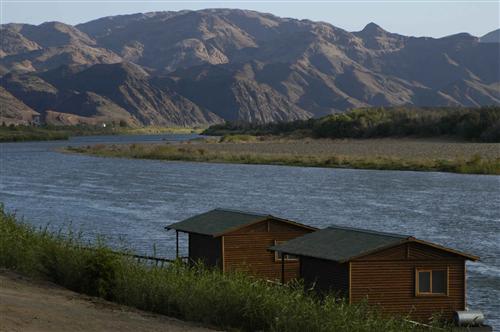
Hydrology of the Orange-Senqu River basin varies from one part of the basin to antoher, in terms of annual rainfall, runoff and evapotranspiration. Given these variabile hydrological conditions, combined with human development demands, much of the basin experiences some degree of water stress.
The hydrology of the Orange-Senqu River basin is discussed in the following terms:
The mean annual precipitation (MAP) in the Orange-Senqu River basin is approximately 1 800 mm at the source of the river, and declines the further west the river flows until it is less than 50 mm per annum. Runoff in the basin is also highly variable in most rivers due to seasonality and rainfall-run off processes, and available runoff from perennial streams is insufficient to meet high demands. While natural runoff in the basin has been estimated to be approximately 11 600 Mm³/a (ORASECOM 2007f), this value has been drastically modified due to flow regime regulation by major water management infrastructure in the basin.
A major issue in the southern African water cycle is that the mean annual evaporation (MAE) often exceeds the MAP, and the Orange-Senqu River basin is no exception (ORASECOM 2007e). MAE from surface waters in the Upper Orange-Senqu River basin is relatively low (1 400 mm and 2 200 mm); however, evaporation increases as the river runs westwards towards the desert region on the West coast, peaking at between 2 000 mm and 2 400 mm from above Boegoeberg Dam to upstream of Vioolsdrif (ORASECOM 2007e).
The water resources of the Orange Senqu River basin are shared by four countries, with significant portions of each country and national populations contained within the basin boundary. Estimates of the country area within the basin are shown in the table below.
Table: Summary of country area of riparian states within the Orange-Senqu River basin
|
Country |
Area in orange Senqu river Basin(km²) |
Percentage of country in basin (%) |
Total Population (country) |
Population in the Basin | Percrentage of Country Population in the Basin (%) |
Percentage of Basin Population(%) |
|
Botswana |
79 000 |
7.9 |
1680 883 | 47 667 | 2.8 | 0.3 |
|
Lesotho |
34 000 |
3.4 |
2 127 539 |
2 127 539 | 100 | 13.5 |
|
Namibia |
245 000 |
24.5 |
1 830 330 | 163 093 | 8.9 | 1.3 |
|
South Africa |
642 000 |
64.2 |
44 819 778 | 13 357 298 | 29.8 | 84.9 |
|
Total |
1 000 000 |
|
50 458 510 | 15 738 115 |
Source: ORASECOM 2009
The water resources of the Orange-Senqu River basin support a large population and significant economic activities, including mining and agriculture, all of which depend on water for survival and growth. The average annual per capita availability of water in the Orange-Senqu River basin is just above 1 000 m3, categorising the region as water stressed (1 000 – 1 700 m3/year), and placing it just above chronic scarcity (500 – 1 000 m³/year.
![]()