|
Water Demand in the Basin:
Water Demand in the Basin |
The natural runoff of the Orange-Senqu River basin has been estimated to be 11 600 Mm³/a and a water balance calculation (Table 1, below) states that approximately 11 490 Mm³/a of this water is used (ORASECOM 2007f). This would indicate almost complete usage of the available water resources. These facts and figures all contribute to the current use of the term 'approaching closure' when discussing the Orange-Senqu River basin. This means that despite significant investments and efforts to manage the water resources of the basin, the point at which there will be no more water to allocate and use is rapidly approaching. Meeting the growing needs for development will soon be very difficult unless effective water demand measures are implemented.
Table 1: Water balance in the Orange-Senqu River basin at 2005 development level.
|
Water Balance Component |
Volume (Mm³/a) |
|
Environmental Requirement |
9001 |
|
Namibia |
1202 |
|
Lesotho & Transfers to South Africa |
8203 |
|
South Africa Orange River Demand |
2 5604 |
|
South Africa Vaal River Demand |
1 5605 |
|
Evaporation & losses |
1 7506 |
|
Spillage |
3 7807 |
|
Total |
11 490 |
|
Spillage under natural conditions |
10 900 |
|
Notes |
|
The estimated water balance for natural runoff conditions is also described in the map below.
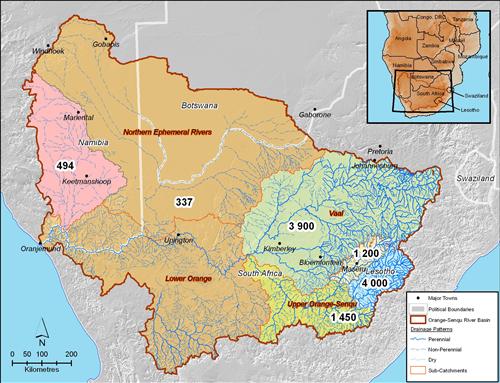
Please note that unlike the rest of the River Awareness Kit, this map treats the Lower Orange and Molopo/Nossob systems as a single unit; and separates the Fish River sub-basin from the other Northern Ephemeral rivers. Furthermore, the Upper Orange-Senqu sub-basin is separated into the Senqu, the Caledon and the Upper Orange Rivers.
The current actual runoff reaching the river mouth is now estimated to be approximately 5 500 Mm³/a (ORASECOM 2007f), which is approximately 48% of the natural runoff described above. Estimates put the demand for water in the basin at 6 500 Mm³/a, with approximately 82% of this use attributed to South Africa (Turton et al 2005).
Table 2 summaries the water requirements of the different sub-basins of the Orange-Senqu River basin.
Table 2: Orange-Senqu system water requirements by catchment.
| Catchment | Water Requirements Mm³/a |
| Vaal | 2 764 |
| Lesotho | 20 |
| Upper Orange | 2 526 |
| Lower Orange | 175 |
| Total | 5 485 |
Source: adapted from UNDP/GEF 2008
Table 3 provides an estimate of the distribution of water requirements by major water use sector for the entire Orange-Senqu River basin. As can be seen from these data, irrigation is by far the single largest user of water in the basin. River losses describes the estimated volume of water lost to evaporation from the river channel. This high percentage is due to the generally high rate of evaporation experienced in many parts of the basin (exceeding 2 000m/yr in some places; UNDP/GEF 2008).
Table 3: Orange-Senqu River basin water requirements by sector.
| Sector |
Total water use (%) |
| Irrigation | 58 |
| Urban, industrial and mining | 4 |
| River losses | 27 |
| Distribution losses | 2 |
| Environmental Requirements | 9 |
Source: UNDP/GEF 2008
While these are approximate annual requirements, there is significant monthly variation in flow, distribution and requirements from the different sectors with in the basin (ORASECOM 2007f).
![]()